Most Shopify merchants check their ads daily and still aren’t sure what the metrics mean and how to correctly evaluate their ads’ performance. Clicks, reach, ROAS, CTR, CPM—there are so many metrics that it’s easy to confuse movement with progress. Some metrics look good on paper, but they don’t mean your ads are making money.
If you’ve ever looked at your Facebook Ads Manager or Easy Ads dashboard and thought, “Is this good or bad?” this article is for you. We’ll simplify the metrics that actually tell you if your ads are profitable and explain how to interpret them correctly in 2025.
Why most advertisers track the wrong metrics
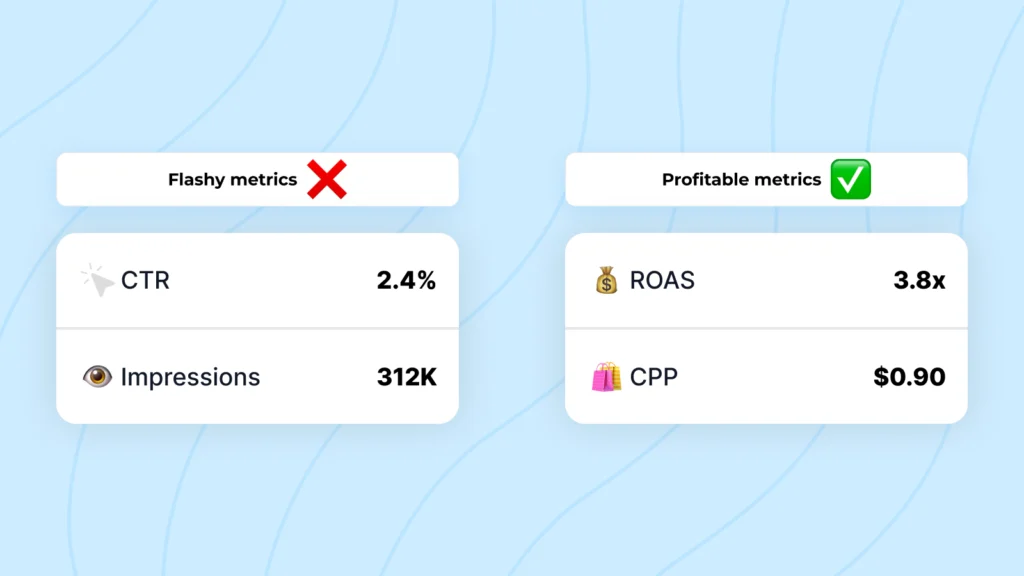
The problem isn’t that Shopify merchants don’t track results; it’s that they focus on metrics that look impressive but don’t show real ad performance. High CTR means nothing if those clicks don’t buy. Low CPC doesn’t matter if ROAS is poor.
You can’t deposit impressions into your bank account. What matters is whether your ad spend creates more revenue than it costs. The rest is noise. If you’ve ever wondered how to run your ads smarter, not harder, this guide on Shopify Ads Automation helps you learn how to run profitable ads easily.
Let’s go through the metrics that actually matter—the ones that reflect real profit, not vanity.
1. Return on Ad Spend (ROAS)
ROAS tells you how much revenue you made for every dollar spent on ads. It’s the single most important metric when evaluating performance.
Formula:
ROAS = Total Revenue from Ads ÷ Total Ad Spend
If you spent $100 and made $400, your ROAS is 4. That means you earned four times what you spent.
How to interpret it:
- ROAS below 1 means you’re losing money.
- ROAS between 1 and 2 usually means you’re collecting data or testing new products.
- ROAS above 3 generally means your campaigns are profitable.
Keep in mind that ROAS depends on your product margins. A store with 60% margins can profit at 2.5x ROAS, while a store with 20% margins may need 4x.
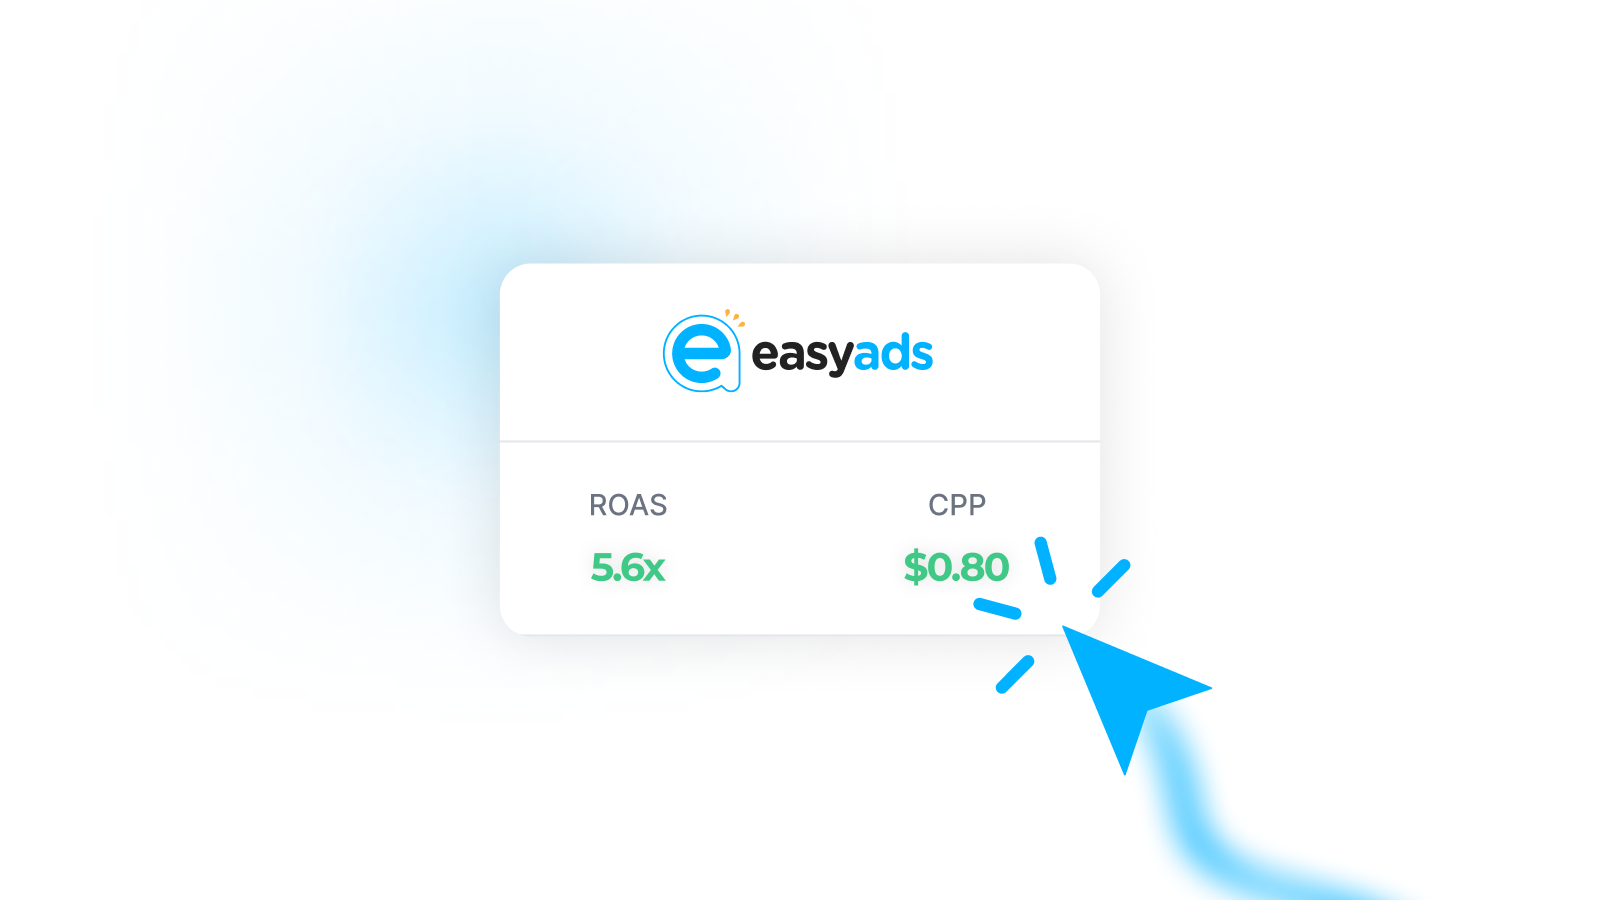
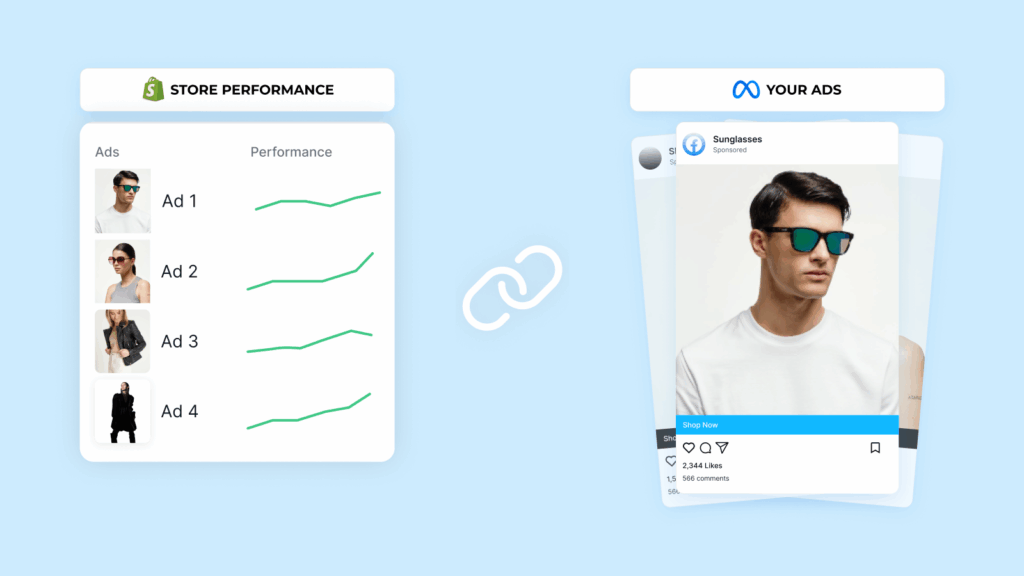
With Easy Ads for Facebook, ROAS is automatically calculated inside your Shopify dashboard using real purchase data from your pixel and Conversions API, so you can trust that the number in your metrics reflects actual performance.
Simplify Your ROAS Tracking
With Easy Ads, your ROAS is automatically calculated using real Shopify purchase data—no manual tracking needed.
Start Your Free Trial2. Cost per Purchase (CPP)
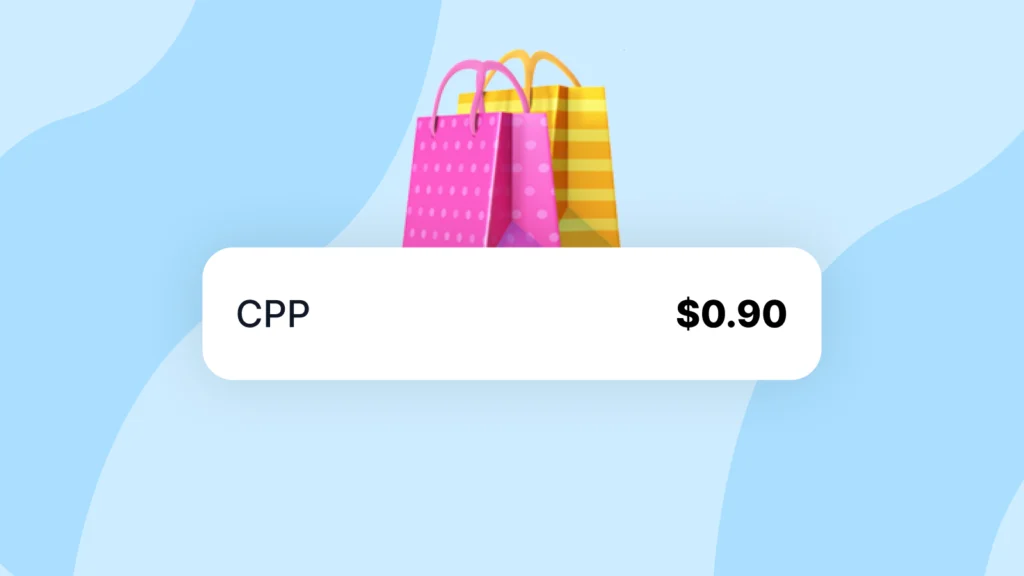
CPP tells you how much you pay to generate one sale. It’s the most direct measure of acquisition cost.
Formula:
CPP = Total Ad Spend ÷ Number of Purchases
If you spend $300 and get 10 purchases, your CPP is $30.
Why it matters:
- It shows how expensive it is to get each new customer.
- It helps you compare performance across products or audiences.
- It’s easier to benchmark than ROAS when testing new products.
Goal: Maintain a CPP that keeps your profit per order positive after all costs. Easy Ads helps you discover this balance automatically by shifting budget to products with the best CPP.
3. Average Order Value (AOV)
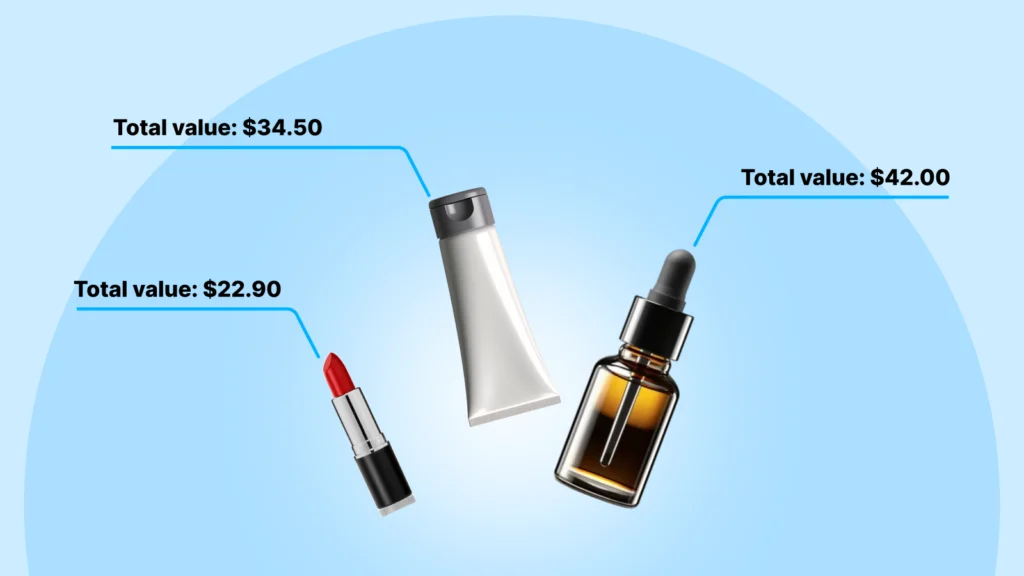
AOV measures how much customers spend per order. It’s a powerful lever for profit because raising AOV can improve ROAS without changing your ad spend.
Formula:
AOV = Total Revenue ÷ Total Orders
If you sell one product for $25 and another for $40, but customers often buy both, your AOV might be $65. Even a small AOV increase can drastically boost your margins.
How to improve AOV:
- Offer bundle discounts (“Buy 2, get 10% off”).
- Show “frequently bought together” items.
- Offer free shipping above a threshold.
Tracking AOV alongside CPP tells you how efficient your ads truly are.
4. Conversion Rate (CVR)
CVR shows what percentage of people who click your ad end up buying.
Formula:
CVR = Purchases ÷ Link Clicks × 100
A good Shopify store with healthy product-market fit usually converts between 1% and 4%. If you’re below that, something in your landing experience is off—maybe pricing, trust signals, or site speed.
Don’t confuse ad quality with website quality. A strong ad can bring the right traffic, but if your product page doesn’t convert, the ad will look like it’s underperforming.
Pro tip: Use eρ—Facebook Pixels & CAPI to make sure all purchase events are tracked accurately. If your CVR looks low but sales exist in Shopify, your tracking is likely incomplete. To improve conversion rate and ensure your pixel is tracking correctly, check out our step-by-step guide on connecting Facebook Ad Accounts to Pixels—it shows exactly how to connect your pixel to your ad account.
5. Cost per Click (CPC)
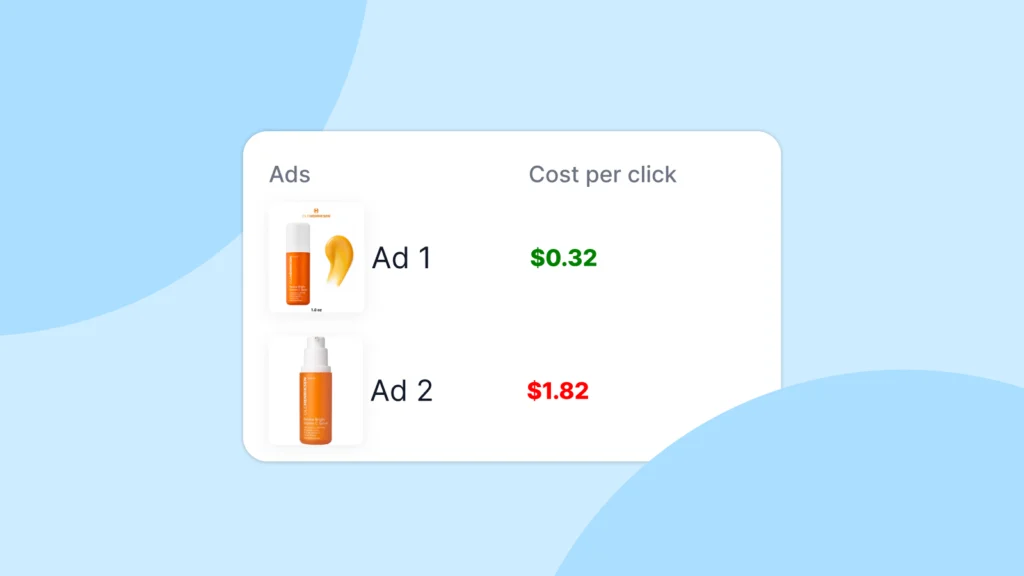
CPC measures how much you pay for each click. It’s helpful for diagnosing engagement but not success.
If CPC is high, it usually means your ad creative isn’t grabbing attention or your targeting is too narrow. A lower CPC doesn’t guarantee profit, but it shows your audience finds the ad relevant.
Focus on CPC when testing creatives, not when judging full campaign profitability.
Benchmarks for Meta ads in 2025:
- General e-commerce: $0.70 – $1.50
- Fashion and beauty: $0.40–$0.90
- High-ticket or niche: $1.50 – $3.00
Easy Ads automatically runs creative variations to lower CPC while protecting ROAS, so you can focus on testing angles, not spreadsheets.
6. Click-Through Rate (CTR)
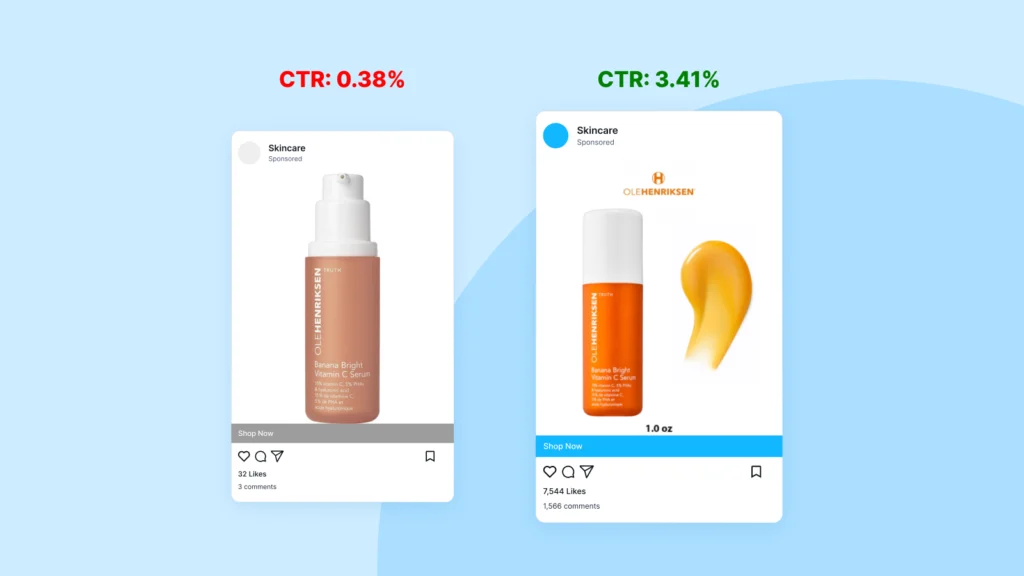
CTR tells you what percentage of people who saw your ad actually clicked it.
Formula:
CTR = Link Clicks ÷ Impressions × 100
A high CTR means your ad gets attention. A low CTR means your hook or visual isn’t strong enough. For most Shopify stores, a CTR between 1% and 3% is solid.
CTR doesn’t equal conversions, but it helps you spot weak creatives before you spend too much on them.
Example:
If your CTR is under 0.8%, test new thumbnails, headlines, or formats like Reels or UGC videos.
7. Frequency: Managing Ad Fatigue in Shopify Ads Performance Metrics
Frequency tells you how many times, on average, each person saw your ad. It matters because ads fatigue quickly. When frequency rises above 3 for cold audiences, your cost per purchase usually climbs.
Keep frequency between:
- 1.5–2.5 for cold campaigns
- 3–5 for retargeting
Once frequency rises too high, refresh creatives. Tools like Easy Ads automatically rotate creatives and allocate spending to fresher ones.
8. Add-to-Cart (ATC) Rate

Add-to- The click rate shows whether people like what they see after clicking. It bridges interest and purchase intent.
Formula:
ATC Rate = Add-to-Cart Events ÷ Product Page Views × 100
If users view but don’t add to cart, the issue might be pricing, shipping cost visibility, or product images. Improving ATC often improves ROAS faster than changing audiences.
Typical benchmarks:
- Average stores: 5–10%
- Strong product fit: 10–20%
With eρ connected, your ATC events stay consistent across Meta and Shopify, giving you a true reflection of behavior.
TA_CUSTOM theme=”facebook” title=”Automate Your ATC Tracking” description=”Keep all Add-to-Cart events consistent across Meta and Shopify and instantly see results.” buttontext=”Install Easy Ads Now” link=”https://easyadsapp.com/”]
9. Purchase Attribution (Tracking Accuracy): The Hidden Pillar of Shopify Ads Performance Metrics
Even perfect campaigns look bad when tracking breaks. If your pixel misses events, your performance data becomes misleading. This is where accuracy becomes a metric of its own.
Using both the Pixel and Conversions API ensures Meta’s AI receives complete data, which improves optimization. eρ – Facebook Pixels & CAPI installs and syncs both automatically, preventing under-reported sales or double-counting.
How to Read Your Shopify Ads Performance Metrics Like a Pro
Here’s how experienced media buyers interpret metrics in order:
- Check ROAS to confirm overall profitability.
- Check CPP and AOV to understand efficiency.
- Check CVR and ATC rate to find conversion bottlenecks.
- Check CTR and CPC only when diagnosing creative issues.
- Monitor frequency to manage ad fatigue.
- Protect tracking integrity with eρ.
Once you read data this way, you stop reacting emotionally to daily fluctuations and start managing ads strategically.
Accurate Tracking. Accurate Results
Easy Ads syncs your pixel and Events API correctly so your data stays clean—no missing or duplicate sales. Get reliable insights for smarter optimization.
Fix Your Tracking NowFinal Thoughts on Shopify Ads Performance Metrics
To run successful campaigns for your Shopify store and maintain good performance, you must use your ads metrics. These metrics are only useful when they tell a story.
ROAS tells you if you’re profitable. CPP shows how much it costs to get a sale. CVR shows if your store converts. CTR and CPC show if your creative works. Together, they paint a complete picture.
You don’t need to chase every number—just the ones that move revenue. With eρ keeping your tracking accurate and Easy Ads managing your campaigns automatically, you can focus on the big picture: spending less time decoding numbers and more time scaling what actually works.
FAQs
Am I keeping an eye on the right Shopify ads performance metrics for my store?
Don’t get distracted by surface numbers like clicks or impressions. The ones that actually matter are ROAS, CPP, CVR, AOV, and your ATC rate—these tell you what’s really going on with your profits.
Which metric should I prioritize to improve my ad campaigns?
Go straight to ROAS. It shows you if your ads are actually making money. After that, take a look at CPP and AOV. They’ll help you figure out how much each sale costs and how to get people spending more.
How can Pixel and Conversions API help boost my ROAS?
Meta Pixel and the Conversions API send accurate data from both your browser and your server, which gives Meta’s AI the info it needs to optimize your ads faster and more effectively.
Leave a Reply